International Analytics, AI, and Alternative Energy Conference 2026
Instructional Supervision System
A Data-Driven Automated System for Monitoring and Evaluation of Teachers’ Performance
Engr. Reynel Mario Canor La Salle Green Hills, Philippines
[0:00] 1. OPENING AND INTRODUCTION
Good morning, everyone.
I am Engr. Reynel Mario Canor from La Salle Green Hills, and today I will be presenting my study entitled, Instructional Supervision System: A Data-Driven Automated System for Monitoring and Evaluation of Teachers’ Performance.
01 · Opening
Act as a subject coordinator. Review every teacher’s curriculum map, learning guide and classroom observation for three trimesters. Then rate each one fairly for merit, tell each exactly what to improve, and find your department’s training needs. Show your evidence.
Put on your Subject Coordinator hat.
Instructional Supervision System · Engr. Reynel Mario Canor · La Salle Green Hills
[~0:25]
Before I begin, I’d like to invite everyone to put on the hat of a Subject Coordinator for a moment. Think about the responsibilities that come with overseeing curriculum implementation, evaluating teachers’ instructional practices, monitoring performance, and identifying professional development needs.
[From Version 1 — gesture to the screen] It’s a familiar prompt — the way we ask an AI to “act as…”. Today, it’s for you.
Now, imagine having to do all these while managing multiple teachers, multiple evaluation documents, and different sets of performance indicators.
01 · Opening
How do we keep up?
Many teachers. Many evaluation documents. Different sets of performance indicators.
?
How do we keep track of everything?
?
How do we see patterns across teachers and departments?
?
How do we turn records into feedback and development?
[~0:50]
How do we keep track of everything?
How do we identify patterns across teachers and departments?
And more importantly, how do we translate all these evaluation records into meaningful feedback and professional development interventions?
These were the practical challenges that motivated this research.
01 · Why it matters
Evaluation shapes a teacher’s growth — and pay
RA 10912
The Philippine CPD Act requires teachers to keep upgrading — which needs objective evidence of the gaps.
11 of 19
countries in an OECD appraisal study link evaluation results to salary .
Sources: Republic Act 10912 (2016); OECD (n.d.); Darling-Hammond et al. (2017)
[~1:15] [From Version 1 — about 20 seconds]
And these challenges matter. Under the Philippine CPD Act, RA 10912, teachers are required to keep upgrading their skills — and choosing the right training needs objective evidence of their gaps.
Evaluation also has real stakes: in an OECD study on teacher appraisal, 11 of 19 countries link evaluation results to salary. So evaluation must be structured, consistent and transparent.
02 · The problem
Three aspects are evaluated
Curriculum Map
How learning outcomes are planned and organized
Learning Guide
How the curriculum becomes instructional design
Classroom Observation
How instruction is implemented in the classroom
But the data was handled manually and in isolation.
[~1:35] 2. THE PROBLEM AND RATIONALE
At La Salle Green Hills, the evaluation of teachers involves three important aspects of instruction.
First, the Curriculum Map, which looks into how learning outcomes are planned and organized.
Second, the Learning Guide, which examines how the curriculum is translated into actual instructional design.
And third, the Classroom Observation Tool, which provides evidence of how instruction is implemented in the classroom.
While these evaluation processes were already being conducted, the challenge was that the information was recorded and monitored through largely manual and isolated processes.
02 · The problem
The problem was not the absence of data. It was how we managed, connected, and used the data.
Performance trends were hard to see
Training needs were hard to pinpoint
Merit rating was slow to consolidate
[~2:10]
As a result, identifying performance trends, determining specific training needs, and consolidating information for merit rating became difficult and time-consuming.
The problem was not the absence of data. The problem was how we managed, connected, and utilized the evaluation data.
This led me to develop an integrated system that would make instructional supervision more systematic, measurable, and data-driven.
03 · Theoretical framework and research design
Anchored on alignment, built by iteration
Theory
Constructive Alignment (Biggs)
Intended outcomes, learning activities and assessment must align.
Planned → Designed → Implemented
Method
Design-Based Research
Refined through actual use, user feedback and emerging requirements.
Not a one-time product
[~2:35] 3. THEORETICAL FRAMEWORK AND RESEARCH DESIGN
The study is anchored on Constructive Alignment Theory by John Biggs, which emphasizes the alignment of intended learning outcomes, teaching and learning activities, and assessment.
This is important because we cannot fully understand teaching performance by looking at classroom instruction alone.
We also need to examine what was planned, how the learning experience was designed, and how these plans were actually implemented.
The system therefore integrates three analytics components: Curriculum Map Analytics, Learning Guide Analytics, and Classroom Observation Tool Analytics.
For the research methodology, I employed Design-Based Research, or DBR.
Rather than developing a system in one attempt and treating it as a finished product, I continuously refined it based on actual implementation, user feedback, and emerging requirements.
This allowed the system to evolve alongside the actual needs of instructional supervision in the institution.
04 · The Instructional Supervision System
Three connected subsystems
Planning
CM Analytics
4 areas: inquiry, concept-building, transfer, self-evaluation
28
indicators
Design
LG Analytics
9 instructional designs, ID1 to ID9
34
indicators
Implementation
COT Analytics
13 teacher and 7 student indicators
20
indicators
Connected, not separate: one view of performance from planning to classroom implementation
[~3:35] 4. THE INSTRUCTIONAL SUPERVISION SYSTEM
Let me now discuss how the system works.
The Instructional Supervision System consists of three interconnected analytics subsystems.
First, Curriculum Map Analytics.
This component evaluates curriculum mapping using 28 indicators distributed across four areas: Real-World Inquiry, Concept-Building and Problem-Solving, Integration and Transfer, and Self-Evaluation.
It allows the Subject Coordinator to determine whether the essential elements of curriculum planning are present and properly developed.
Second, Learning Guide Analytics.
This component evaluates learning guide development using 34 indicators organized into nine instructional designs, identified as ID1 to ID9.
These indicators help determine whether the instructional plans provide the necessary learning experiences, activities, and opportunities for students to achieve the intended learning outcomes.
Third, Classroom Observation Tool Analytics.
This component focuses on actual classroom implementation.
It uses 20 observable indicators, consisting of 13 teacher-related indicators and 7 student-related indicators.
Unlike the first two components, which examine instructional planning and design, this subsystem provides evidence of what actually happens during classroom instruction.
Now, what makes these three components significant is that they are not treated as separate evaluation results.
They are connected to provide a more comprehensive view of teacher performance, from planning, to instructional design, and finally, to classroom implementation.
04 · Google Sheets + Apps Script
One click turns a checklist into a report
Encode
Mark each indicator Accomplished or Needs Improvement
Compute
Scores on a four-point system, stored automatically
Visualize
The analytics dashboard updates
Report
A PDF report goes to the teacher via Gmail
[~5:05]
Technically, the system was developed using Google Sheets and Google Apps Script.
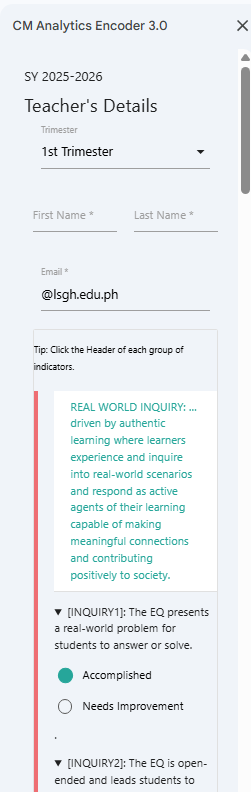
The evaluators, primarily the Subject Coordinators, access a structured interface where they encode teacher information and evaluate the indicators using two selections: Accomplished or Needs Improvement.
Upon submission, the system processes the encoded information, computes the corresponding scores using a four-point scoring system, stores the results, updates the analytics dashboard, and generates a PDF performance report.
The report is then automatically sent to the concerned teacher through Gmail.
In other words, what previously involved several manual steps in recording, consolidating, analyzing, and communicating evaluation results is now handled through an integrated workflow.
05 · Analytics and reporting
The dips are the training needs
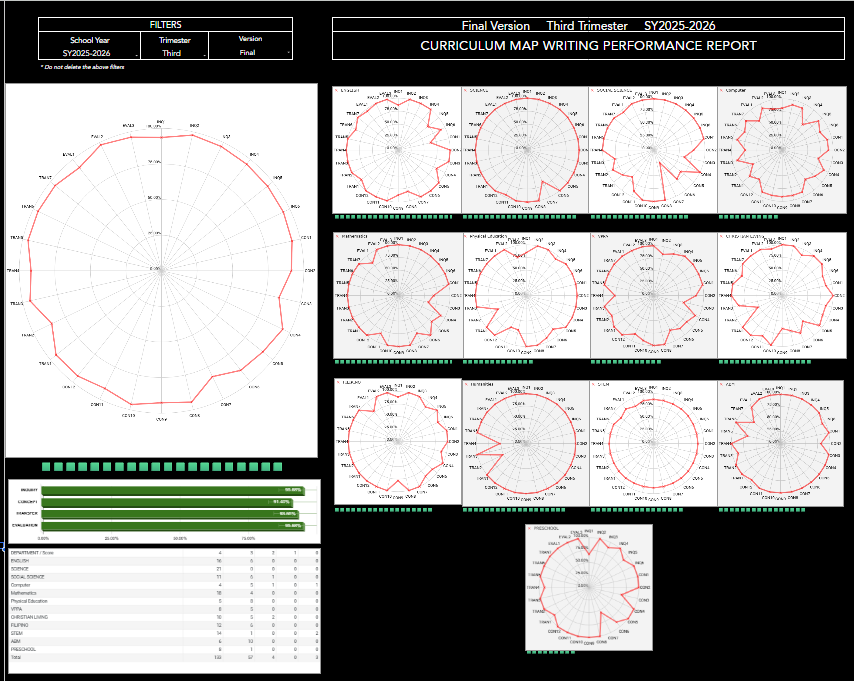
CM and LG radars: every indicator at once, by department
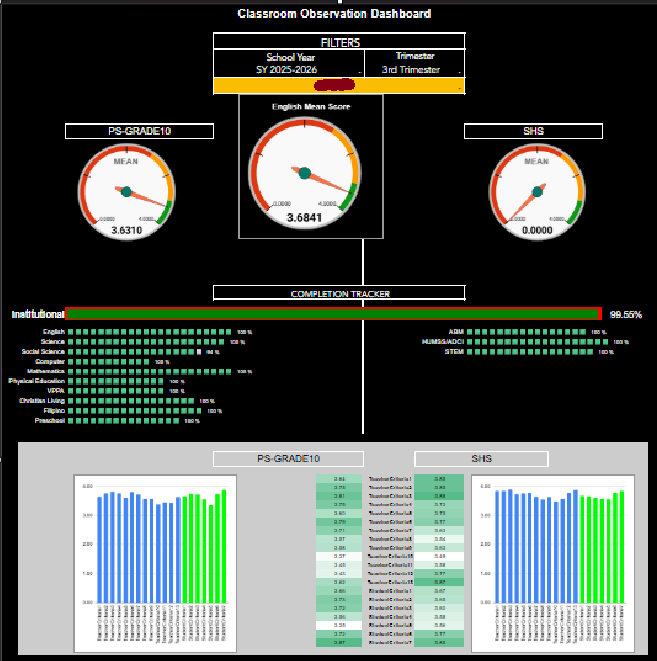
COT dashboard: gauges, look-fors and a tracker — 99.55% observed
[~6:05] 5. ANALYTICS, REPORTING, AND MERIT RATING
Let me highlight the value of the analytics.
The system provides both an institutional or departmental perspective and an individual teacher perspective.
For the Curriculum Map and Learning Guide, radar charts allow coordinators to quickly identify areas of strength and areas requiring improvement.
For classroom observations, the dashboard presents gauge charts, indicator-level results, and completion trackers.
These visualizations make it easier to identify patterns without having to manually review numerous evaluation documents.
But perhaps more importantly, the system does not stop at generating scores.
It provides indicator-level feedback, allowing teachers to identify exactly which areas need attention.
05 · Merit rating
Evidence becomes one merit score
CM Analytics
Domain 1 · Curriculum Planning and Development
5%
LG Analytics
Domain 2 · Content Knowledge and Pedagogy
5%
COT Analytics
Domain 3 · Instruction
15%
Averaged across three trimesters — one basis for merit rating.
[~6:50]
The outputs of the three analytics subsystems are also integrated into the institutional merit rating system.
Curriculum Map Analytics contributes to Domain 1: Curriculum Planning and Development.
Learning Guide Analytics contributes to Domain 2: Content Knowledge and Pedagogy.
And Classroom Observation Tool Analytics contributes to Domain 3: Instruction.
The results are consolidated across three trimester evaluations and used as one of the bases for institutional merit rating.
This establishes a more structured and evidence-based approach to evaluating teacher performance.
06 · Results and findings
Every construct rated above 4.8
Monitoring teacher performance
4.81
Data accessibility and interpretability
4.85
Decision support for coaching and PD
4.83
Evidence-based contribution to merit rating
4.89
System improvement and responsiveness
4.89
10
Subject Coordinators surveyed
Five-point Likert scale
[~7:35] 6. RESULTS AND FINDINGS
Now, let us look at the findings of the study.
To complement the system-generated data and documented refinements, a system evaluation survey was administered to ten Subject Coordinators using a five-point Likert scale.
The results were particularly encouraging.
Monitoring Teacher Performance received a mean of 4.81.
Data Accessibility and Interpretability received 4.85.
Decision Support for Coaching and Professional Development received 4.83.
Evidence-Based Contribution to Merit Rating received 4.89.
And System Improvement and Responsiveness also received 4.89.
All five constructs obtained mean ratings ranging from 4.81 to 4.89 out of 5.
The results indicate a consistently positive evaluation among the respondents.
06 · Results and findings
Beyond the numbers
In coordinators’ words
“…ang kalakasan at kailangan pang paunlarin ng mga guro at ng department.”
the strengths of teachers and the department, and what still needs developing
“…design more targeted and specific action plans.”
Six development cycles refined
Scoring and visualization
Indicator-level analysis
Data integrity
Collaborative evaluation
Automated report distribution
Key contribution: a school can grow its own decision-support system by answering real operational needs.
[~8:20]
Beyond these numerical results, the implementation also demonstrated practical improvements in instructional supervision.
Coordinators were able to identify strengths and areas for improvement across teachers and departments, develop more targeted action plans, and use performance information to guide professional development discussions.
The system also facilitated more timely feedback because reports could be automatically generated and distributed after evaluation.
An important point I would like to emphasize is that the system was not developed overnight.
Its effectiveness came from continuous refinement based on actual use.
Across six development cycles, improvements were made to scoring, visualization, indicator-level analysis, data integrity, collaborative evaluation, and automated report distribution.
This is one of the key contributions of the study: demonstrating how an educational institution can progressively develop a decision-support system by responding to its actual operational needs.
07 · Conclusion
Three contributions
Act as a subject coordinator. … Show your evidence. Now you can.
1
A systematic, measurable way to monitor teacher performance
2
Professional development needs identified through specific indicators
3
A structured, evidence-based contribution to merit rating
[~9:30] 7. CONCLUSION, LIMITATIONS, AND RECOMMENDATIONS
[From Version 1, one line] Remember the hat you put on at the start? Here is what that coordinator now has.
To conclude, this study demonstrates how an integrated analytics system can address fragmented evaluation records and improve the way instructional supervision information is managed and utilized.
It provides three important contributions.
First, it establishes a more systematic and measurable approach to monitoring teacher performance.
Second, it supports the identification of professional development needs through specific performance indicators.
And third, it provides a more structured and evidence-based contribution to institutional merit rating.
07 · Limitations and recommendations
Limits and next steps
Limitations
Criteria are institution-specific
Coordinators use it; teachers receive reports
Teacher-made assessments not covered
Effect of training interventions not measured
Recommendations
Keep calibrating the scoring model
Stronger access controls
Standardized teacher identification
Report preview before sending
Periodic review of indicators
[~10:05]
However, the system also has limitations.
Its evaluation criteria are institution-specific. Its primary users are Subject Coordinators, while teachers receive the generated reports. It does not cover analytics of teacher-made assessments, nor does the study measure the direct relationship between training interventions and subsequent teacher performance.
For future development, I recommend continuous calibration of the scoring model, stronger access controls, standardized teacher identification, report preview functionality, and periodic review of evaluation indicators to ensure alignment with the institution’s curriculum framework and mission.
08 · Closing remarks
The real value of evaluation is what we do with the information afterward.
From a compliance activity to an instrument for continuous improvement.
Thank you very much. Engr. Reynel Mario Canor · La Salle Green Hills
International Analytics, AI, and Alternative Energy Conference 2026 · De La Salle University
[~10:50] 8. CLOSING REMARKS
Ultimately, I would like to leave everyone with one important thought.
Instructional supervision should not end with evaluating teachers or assigning performance scores.
The real value of evaluation is what we do with the information afterward.
When we can identify specific areas for improvement, provide meaningful feedback, and translate evidence into appropriate professional development interventions, we move beyond evaluation as a compliance activity.
We make it an instrument for continuous improvement.
And that is what the Instructional Supervision System aims to achieve: transforming evaluation data into meaningful decisions that support both teacher development and the quality of instruction.
Thank you very much, and good morning.
Next step · Learning Outcomes Analytics
Evaluation completes the cycle
1 · Planning
CM + LG Analytics
Is the plan aligned with intended outcomes?
In use
2 · Implementation
COT Analytics
Is the plan carried out in the classroom?
In use
3 · Evaluation
Learning Outcomes Analytics
Did students actually learn? Results feed back into planning.
Next
[Backup slide — show only if someone asks about next steps]
Thank you for that question.
At present, the Instructional Supervision System covers two stages of the instructional cycle: planning, through Curriculum Map and Learning Guide Analytics, and implementation, through Classroom Observation Tool Analytics.
The natural next step is evaluation — determining whether students actually achieved the intended learning outcomes. This is the focus of the Learning Outcomes Analytics, which is now being developed.
With it, the system completes the cycle of planning, implementation, and evaluation, consistent with Constructive Alignment. It also responds to one of the limitations of this study, which does not yet cover teacher-made assessments or student learning outcomes.
The results of the Learning Outcomes Analytics will then feed back into planning, so that the cycle of improvement continues.
[Reminder: the live app requires an LSGH account and may show actual data. For an external audience, describe it instead of opening it.]